National Map making Competition 2025
Quest GIS presents National Map Making Competition-2025
Join India’s most accessible, impactful map-making competition! Use open-source GIS tools to visualize one of the world’s pressing issues—climate, health, water, gender—you decide. Whether you’re new to mapping or a seasoned cartographer, this is your chance to showcase your story through spatial data.
Submissions and Description
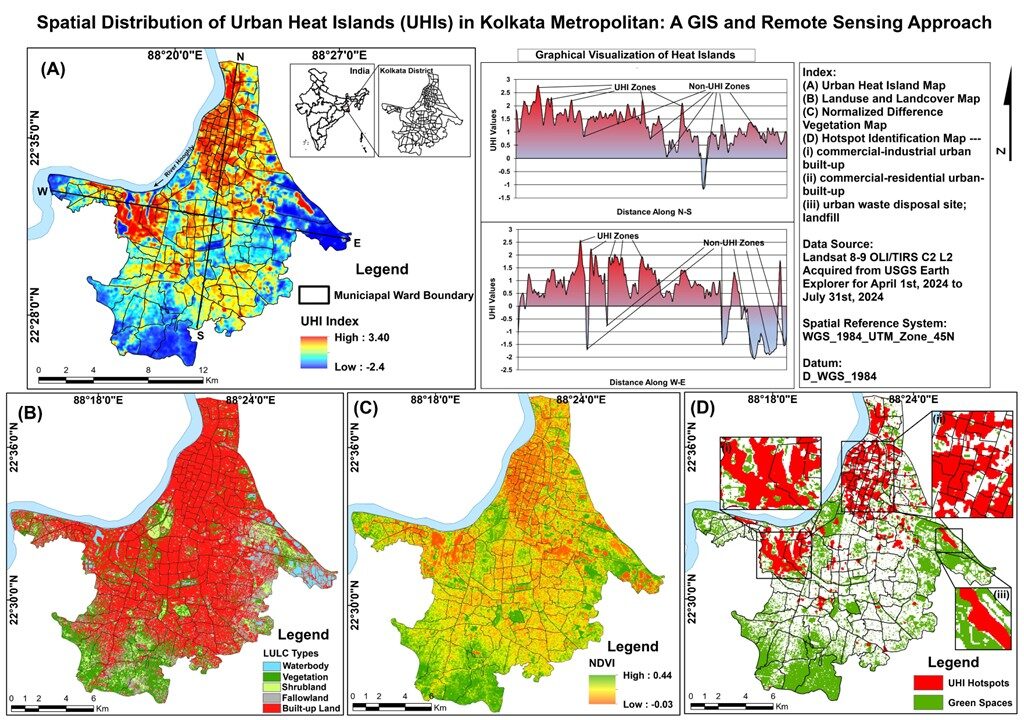
Spatial Distribution of Urban heat Islands (UHIs) in Kolkata Metropolitan: A GIS and Remote sensing Based Approach
Kolkata Metropolitan Area and its suburbs are one of the most rapidly urbanizing zones of India at present. Dense population distribution, increasing built-ups and diminishing green spaces and waterbodies culminate in the form of alarmingly rising surface temperatures during peak summer months. This necessitates for a proper spatial analysis of the occurrence of heat pockets within the city by integrating multi-faceted environmental factors and urban parameters.
Methodology: Landsat 8-9 OLI/TIRS images were acquired from April to July, 2024 from the US Geological Survey webpage (https://earthexplorer.usgs.gov) which were converted to WGS84/45N projection system. The Land Surface Temperature (LST) tool was developed using the NDVI-based LSE (Land Surface Emissivity) algorithm to generate the UHI Index in QGIS 3.34.11.
Map Analysis: The findings from the map reveal that high-intensity UHI zones are concentrated in densely built-up, commercial-industrial wards with minimal vegetation, while peripheral zones show lower UHI intensity. A strong negative correlation is observed between NDVI and UHI intensity, emphasizing the cooling role of green cover. The spaces with NDVI values higher than 0.3 (NDVI > 0.3) have been identified as green spaces, typically representing city parks, meadows etc. UHI Hotspots have been mapped by recognizing the UHI pixels with Dn values greater than the sum between Mean and twice of Standard Deviation i.e. UHI > Mean + 2 S.D. This Hotspot analysis identifies three key drivers of UHI formation —built-up concentration, mixed-use urban typologies, and waste disposal site. Graphical transects along N–S and W–E axes capture sharp thermal gradients between urban cores and vegetated fringes. The map synthesizes thermal, land use, and vegetation patterns to support spatial planning strategies aimed at mitigating heat stress in rapidly urbanizing environment of the city.
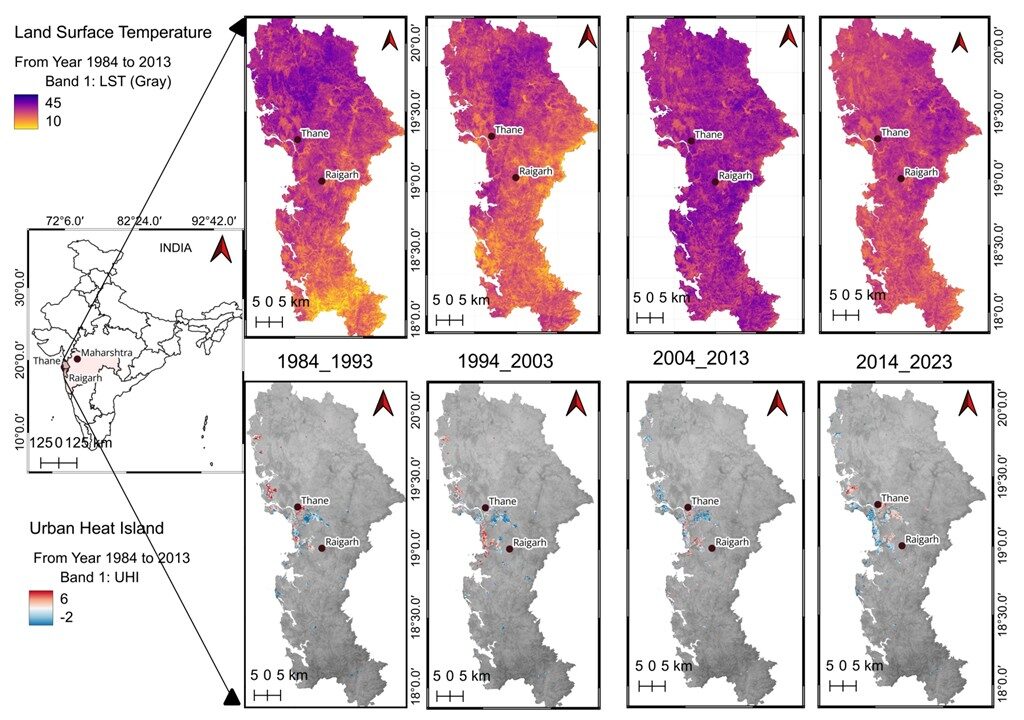
Spatiotemporal evolution of Land Surface Temperature (LST in °C) and Urban Heat Island (UH iin °C) across Thane and Raigad districts of Maharashtra from 1984 to 2023.
The maps highlight increasing surface temperatures and intensifying UHI effects in response to widespread urban growth and infrastructure development.
The four-decade (1984–2023) Land Surface Temperature (LST) and Urban Heat Island (UHI) mosaics across the Thane–Raigad district reveal a spatially consistent trend, i.e. areas experiencing the most surface warming correspond closely with zones of rapid and extensive urban expansion.
During the initial decade (1984–1993), the mean LST across the coastal plain averaged approximately 26 °C, with UHI rarely exceeding +1 °C above surrounding rural baselines. By 1994–2003, the emergence of low-rise housing and industrial estates along Thane Creek and the Panvel lowlands elevated mean surface temperatures to 29–30 °C, with localized UHI peaks reaching +2.5 °C. The subsequent two decades witnessed a pronounced surge in horizontal infrastructure—marked by the growth of airport logistics hubs in Navi Mumbai, warehouse corridors along the Mumbai–Goa highway, and dense residential sprawl in areas such as Kalyan–Dombivli and Uran. LST from 2004–2013 show widespread zones exceeding 32 °C, while the 2014–2023 composite reveals dense urban tracts surpassing 35 °C, with UHI intensities in some locations exceeding +4 °C.
Pixel-level statistical analysis confirms a near-linear relationship between rising decadal mean LST and UHI intensity (R² ≈ 0.82). High-UHI zones consistently align with classified urban land cover, while cooler zones correspond to mangroves, tidal creeks, and elevated terrain that remained relatively untouched. Given the region’s generally low topographic relief, the dominant drivers of thermal contrast are anthropogenic specifically the replacement of vegetated surfaces with asphalt, concrete, sheet-metal roofing, and impervious yards.
This pattern illustrates Maharashtra’s most prominent case of “horizontal urbanisation.” Since 1990, Thane and Raigad districts have added over 1,000 km² of built-up area, more than any other district pair in the state, surpassing even Pune’s vertically concentrated core. This outward expansion, rather than vertical densification, has intensified surface heating and enlarged the UHI footprint with each passing decade. The temporal progression underscores an urgent need for adaptive mitigation strategies: prioritizing compact urban design, restoration of green buffers, and the use of high-albedo construction materials. Without such interventions, both LST and UHI are likely to escalate further along the eastern periphery of Mumbai Harbour.
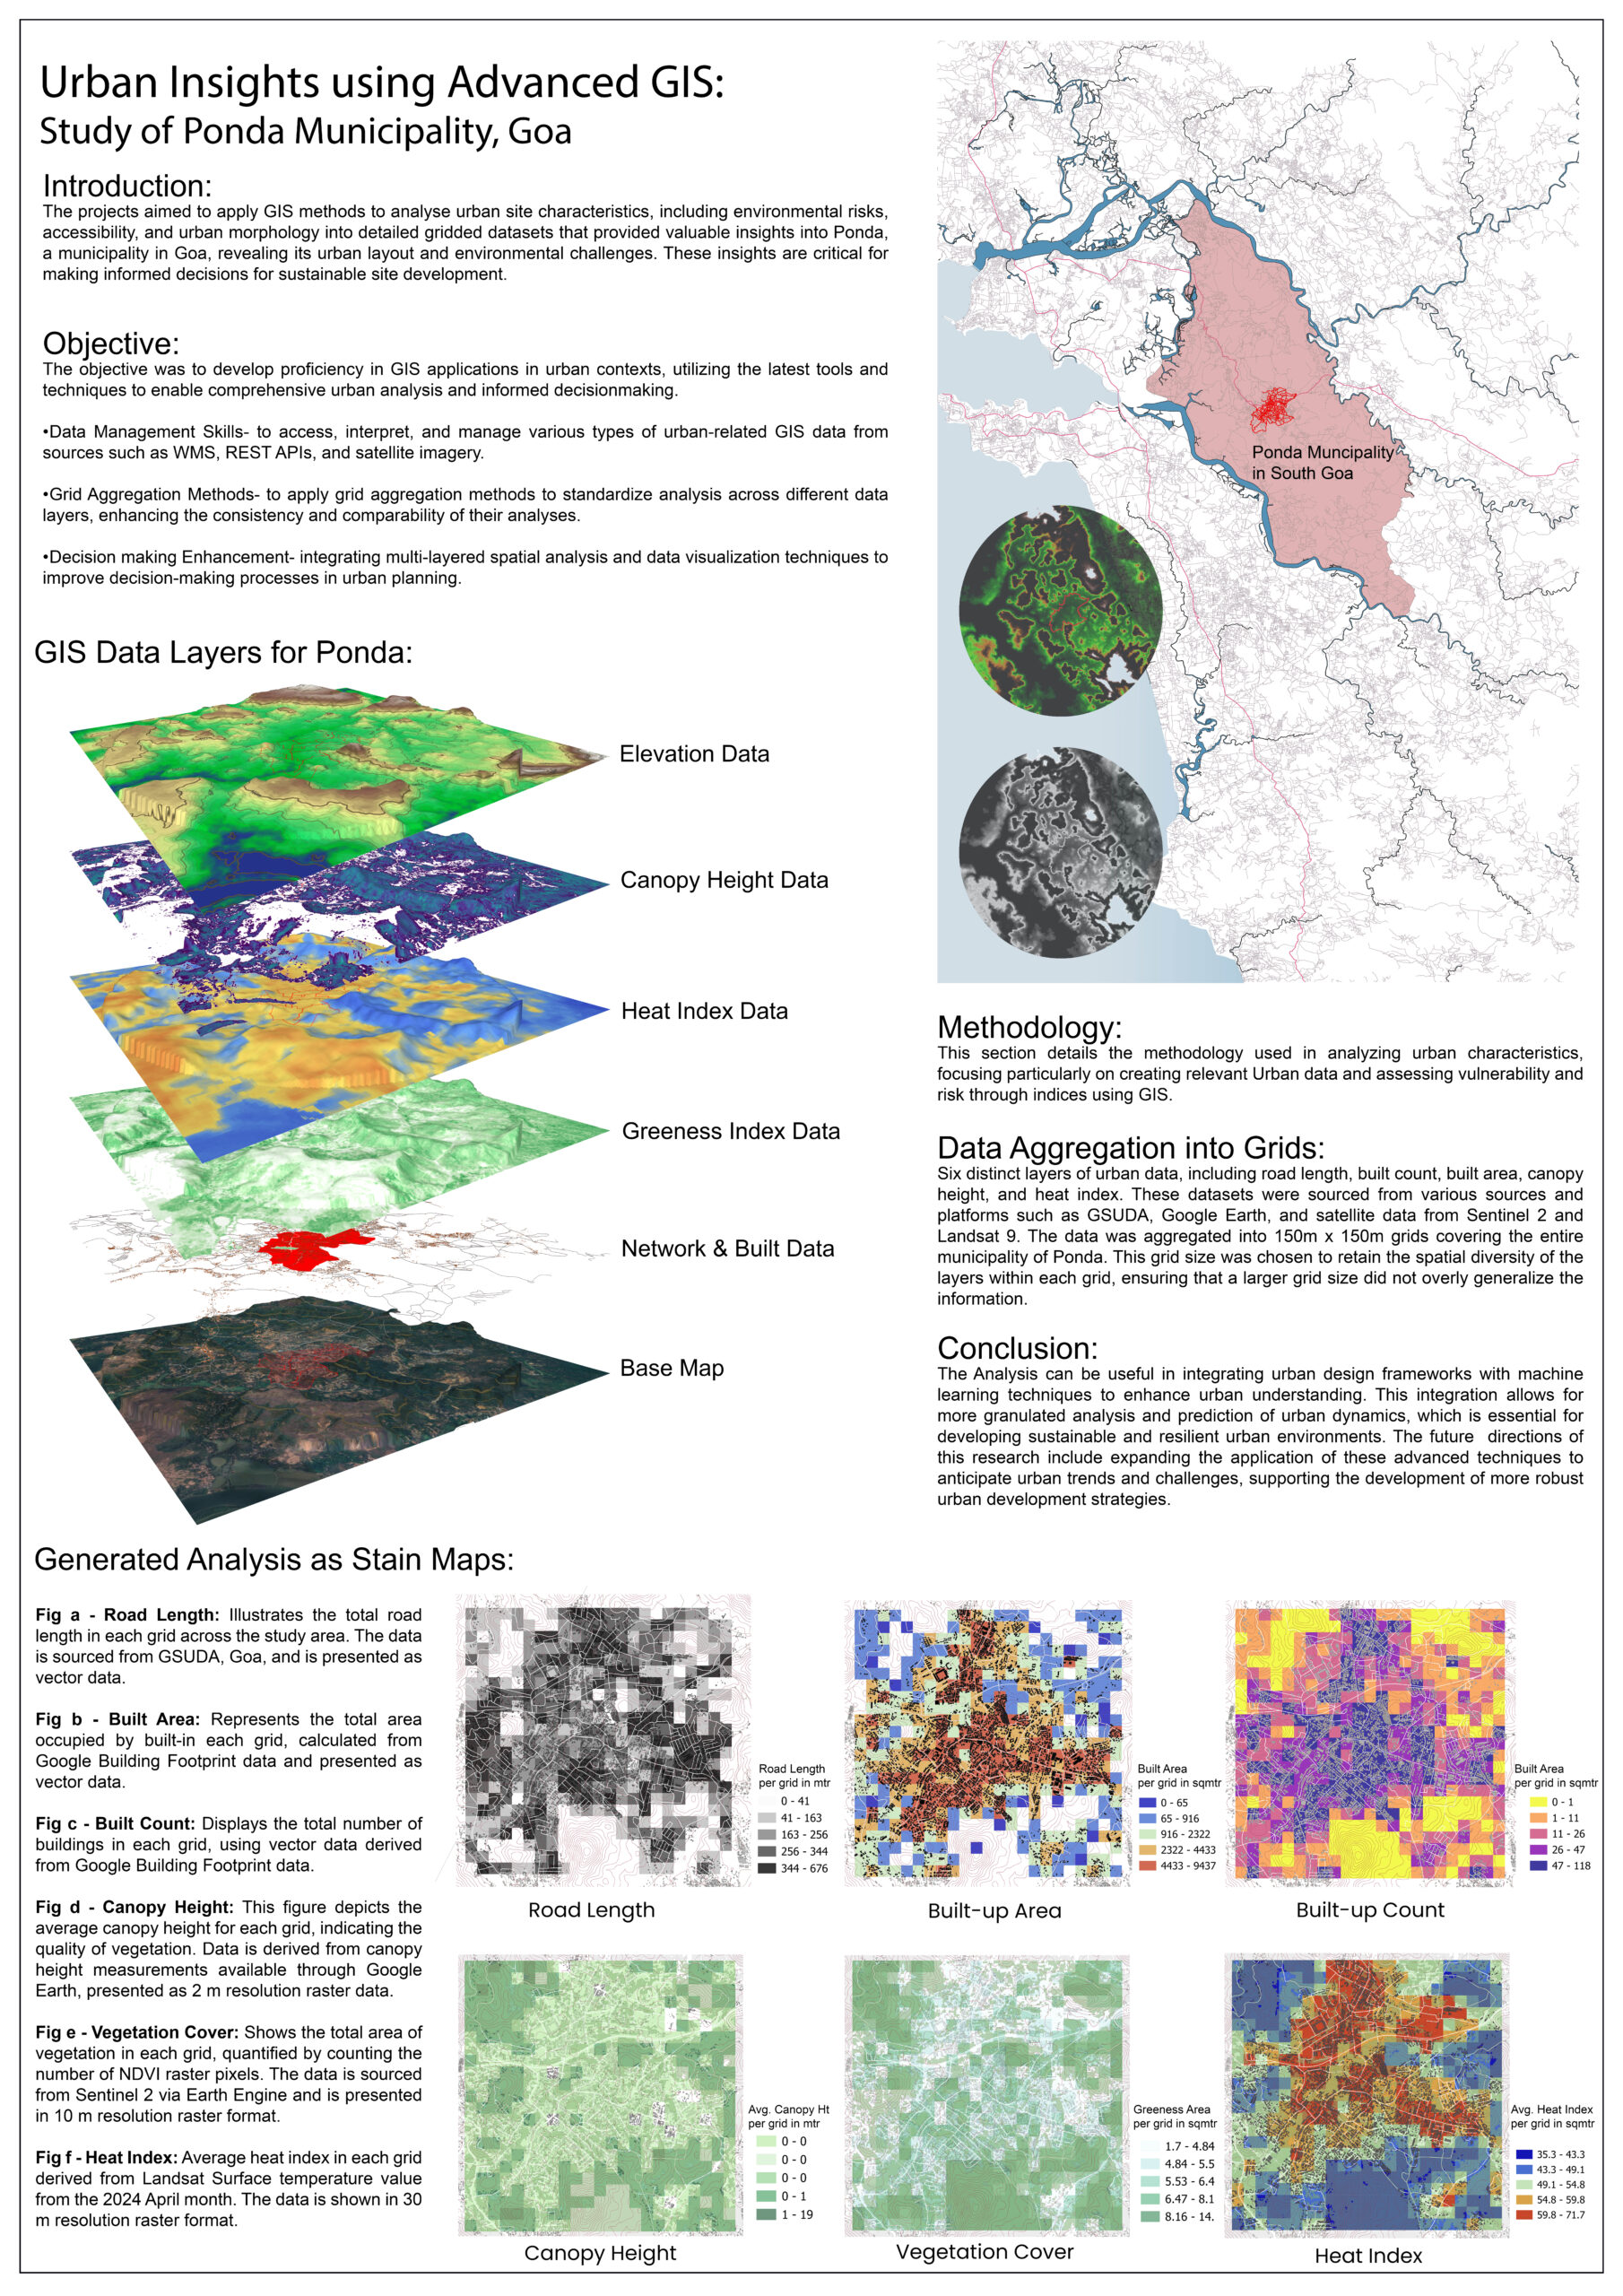
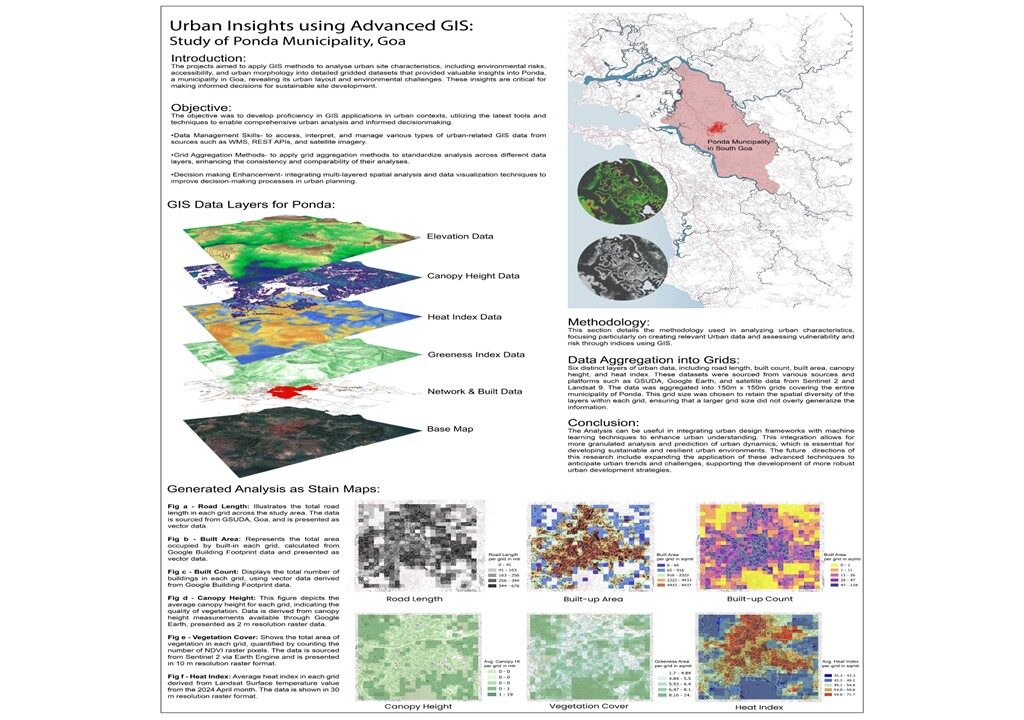
Urban Insights Using Advanced GIS: Study of Ponda Municipality, Goa
Introduction
The projects aimed to apply GIS methods to analyse urban site characteristics, including environmental risks, accessibility, and urban morphology into detailed gridded datasets that provided valuable insights into Ponda, a municipality in Goa, revealing its urban layout and environmental challenges. These insights are critical for making informed decisions for sustainable site development.
Objective
• Data Management Skills- to access, interpret, and manage various types of urban related GIS data from sources such as WMS, REST APIs, and satellite imagery.
• Grid Aggregation Methods- to apply grid aggregation methods to standardize analysis across different data layers, enhancing the consistency and comparability of their analyses.
• Decision making Enhancement- integrating multi-layered spatial analysis and data
visualization techniques to improve decision-making processes in urban planning.
Analysis
Creation of six distinct layers of urban data, including road length, built count, built area, vegetation cover, canopy height and heat index. These datasets were sourced from various sources and platforms such as GSUDA, Google Earth, and satellite data from Sentinel 2 and Landsat 9. The data were aggregated into 150m x 150m grids covering the entire municipality of Ponda. This grid size was chosen to retain the spatial diversity of the layers within each grid, ensuring that a larger grid size did not overly generalize the information.
Conclusion
The Analysis can be useful in integrating urban design frameworks with machine learning techniques to enhance urban understanding. This integration allows for more granulated analysis and prediction of urban dynamics, which is essential for developing sustainable and resilient urban environments. The future directions of this research include expanding the application of these advanced techniques to anticipate urban trends and challenges, supporting the development of more robust urban strategies.
Links:
https://extract.bbbike.org/
https://bhunaksha.goa.gov.in/bhunaksha/#layer-pane
https://dslr.goa.gov.in/
https://www.gpsvisualizer.com/elevation
https://www.gsuda.org/
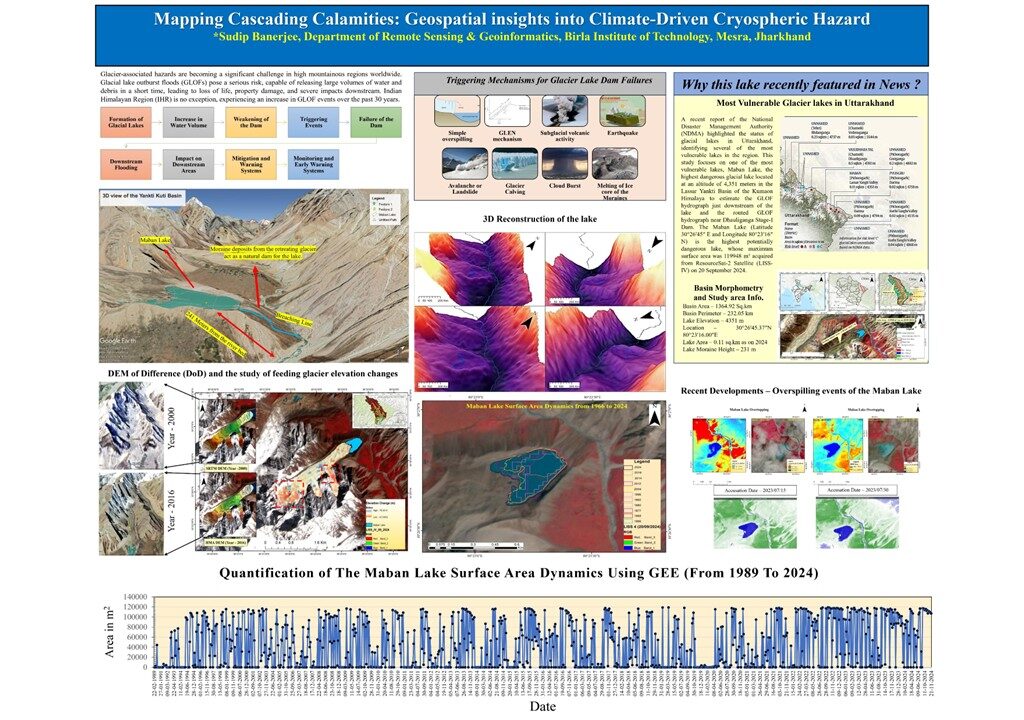
Mapping Cascading Calamities: geospatial insights into Climate-Driven Cryospheric Hazard
Result and Discussion
The OST map by Swiss Foundation for Alpine Research does not display the lake. It follows that the lake was most likely formed after 1955. The 1976 Landsat MSS data shows the lake’s initial occurrence. The lake area extent and glacier limit were plotted using the MSS data. Beginning in 1955, the glacier receded by around 177 meters, leaving a lake in its wake. Along the glacier’s centre line, length measurements were taken. The lake’s aerial size was 0.035 km2 in 1976. It is connected to the glacier terminus and is surrounded by both terminal and lateral moraines. The glacier limit and the lake’s area were mapped in 1990 using Landsat TM data.
In comparison to its earlier 1976 extent, the glacier receded 18 meters, and the lake expanded by 0.013 km^2. The lake began to split off from the glacier terminus in 1990, becoming a separate body of water. The glacier has receded 128 meters, according to the most recent extent measured in 2005, and the lake has expanded to a total area of 0.029 km2 since 1990. The lake and the glacier terminus have totally parted, according to satellite imagery from 2005. Nevertheless, the predicted discharge error is uncertain due to a lack of field data. The lake doesn’t appear to have the potential for GLOF based on the modelled discharge data. However, these kinds of natural disasters are unpredictable and can also affect areas across borders. In the Himalayan area of India, flash floods caused by unexpected rainfall due to cloudburst is very common in monsoon period. The formation of cloudburst over glacial lakes can cause dangerous GLOFs.
Difficulties
a. Difficulty obtaining cloud-free images during the monsoon season, which is crucial for studying the heterogeneous response of the lake. To address this, I had to use multi-sensor data to acquire the necessary images.
b. Handling a large amount of spatial data from 1962 to 2024 is quite challenging.
c. Limited availability of high-resolution data for long time-series analysis of lake evolution.
d. Lack of field data for volume measurement of the lake, which is essential for hydrodynamic modelling.
e. Absence of high-resolution digital elevation models and digital surface models for the basin, which are key factors for accurate GLOF modelling simulations.
Applications
This analysis of the potentially vulnerable glacial lake provides a comprehensive understanding of the complexities involved in its evolution and the heterogeneous responses exhibited by the lake system. The generated maps are instrumental in assessing GLOF (Glacial Lake Outburst Flood) vulnerability.
Link of the GEE Code for Lake Area Estimation – https://code.earthengine.google.com/4b4661ffd04f433c3faef63dc19c2f33
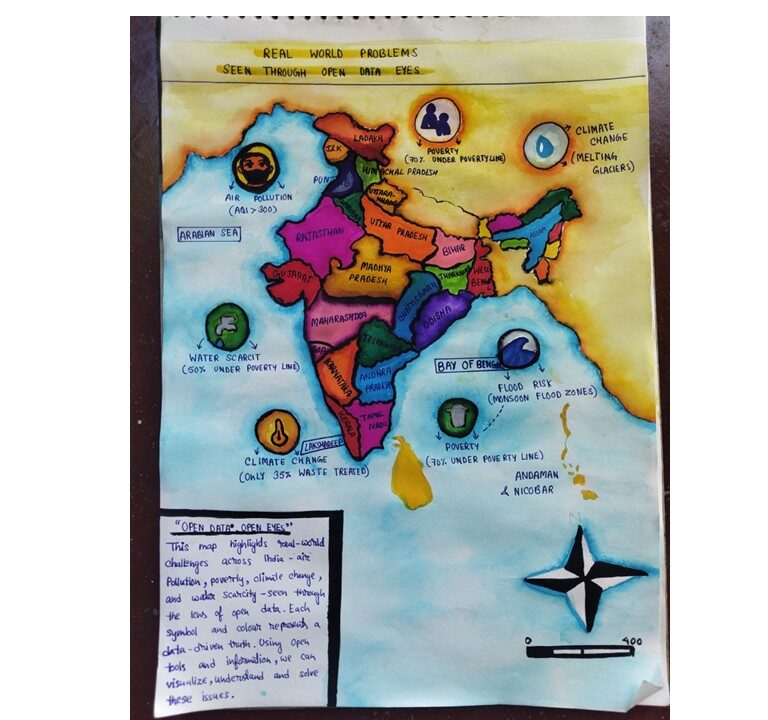
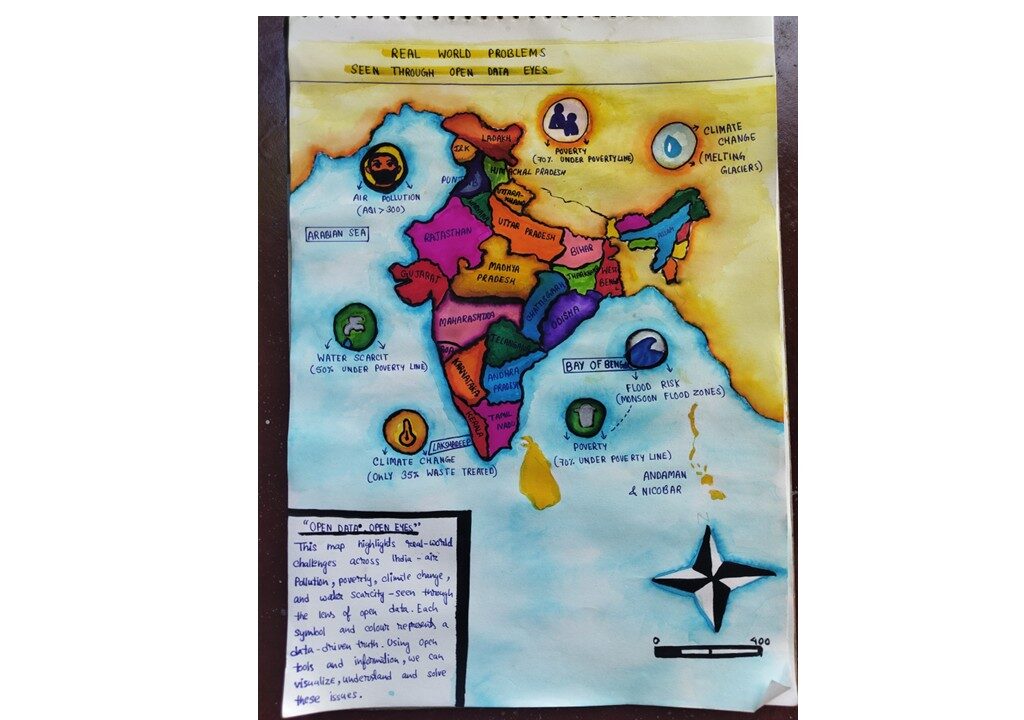
Real World Problems Seen Through Open Data Eyes
This map presents a visual story of India’s most pressing real-world challenges, interpreted through the powerful lens of open data and represented with the help of open tools like GIS (Geographic Information Systems). The aim of this map is not just to show geography—but to show truth hidden in plain sight.
Each state on this map is colorfully illustrated, but the real depth lies in the symbols and data annotations. For example:
Delhi shows severe air pollution (AQI > 300).
Himalayan regions depict climate change effects such as melting glaciers.
States like Jharkhand and Odisha highlight high poverty rates, with more than 70% of people living below the poverty line.
Karnataka and Telangana show water scarcity conditions, with nearly half the population lacking adequate access.
Coastal regions near the Bay of Bengal represent monsoon flood risks, marked as high flood-prone zones.
The sources of these issues are real and documented by open data from platforms like:
India Meteorological Department (IMD)
Central Pollution Control Board (CPCB)
Census of India
NITI Aayog Water Report
ISRO’s Bhuvan GIS platform
This map transforms raw data into an emotional and educational visual, helping viewers not just see problems—but understand their locations, scale, and urgency. By using open data and tools, anyone—from students to decision-makers—can access, analyze, and act. This map is a call to awareness, showing how technology and transparency together can guide India toward smarter, data-driven solutions.
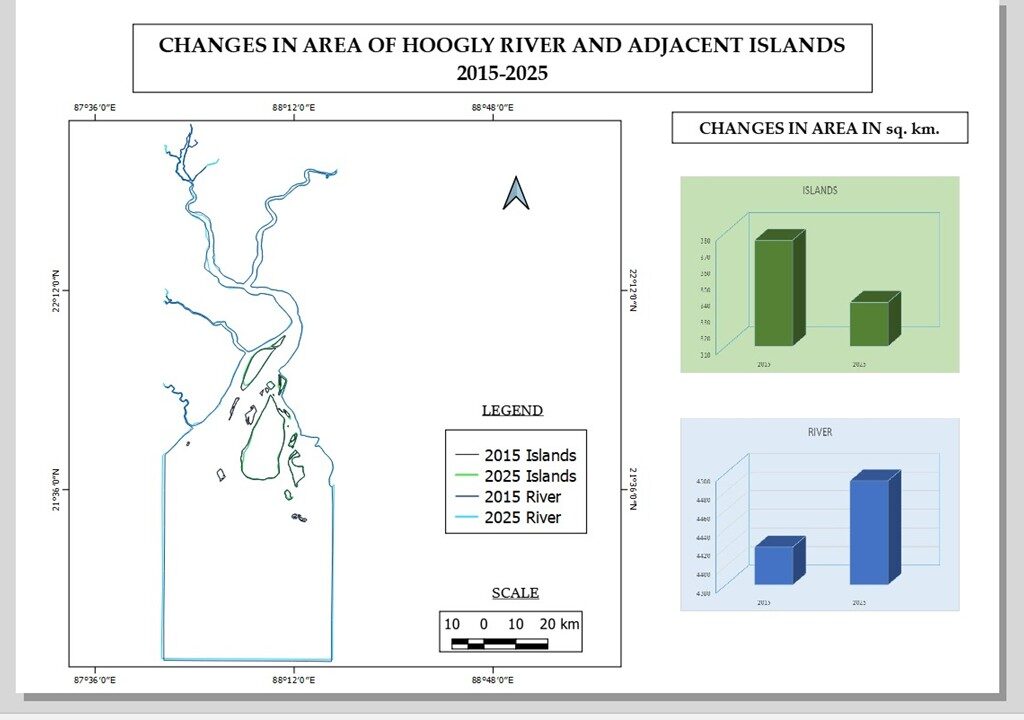
Change Detection Analysis (2015-2025) In the Area of Hooghly River and Adjacent Islands (Near Sundarbans)
Change detection can be defined as the process of identifying differences in the state of an object or phenomenon by observing it at different times. this process is usually applied to earth surface changes at two or more times. The primary source of data is geographic and is usually in digital format (e. g., satellite imagery), analogue format (e. g., aerial photos), or vector format (e. g., feature maps). Ancillary data (e. g., historical, economic, etc.) can also be used. In geographic information system (gis), change detection is a process that measures how the attributes of a particular area have changed between two or more time periods. Change detection often involves comparing aerial photographs or satellite imagery of the area taken at different times. Change detection has been widely used to assess shifting cultivation, deforestation, urban growth, impact of natural disasters like tsunamis, earthquakes, and use/land cover changes etc.
By the use of qgis preparing a change detection analysis that showing the changes of areas of Hooghly River, Nayachar and Sagar islands from 2015 to 2025.the area its lies in Sundarbans. The latitudinal extension is 21 degree 36 minutes to 22degree 12 minutes and longitudinal extensions from 87 degree 36 minutes to 88 degree 48 minutes. After creating polygon layer name as river 2015, river 2025, delta 2015 and delta 2025.after digitized areas and calculates area in sq. km in attribute table by the help of geometry $area. The computing area copied in excel and insert a bar diagram which showing the changes areas of 2015 to 2025. The bar diagram showing that from 2015 to 2025 islands areas decreases but river areas increase that’s tells river expand cause water level increases day by day cause these areas lied near Bay of Bengal. That’s why island’s area decreases. Time to time changes occurs Hooghly River and adjacent island areas.
Sources: USGS earth explorer 2015 and 2025 tm and oil data, qgis, excel